
 By Sonam Tripathi

Morningstar India found that technology funds returned an average of 27.5% a year over three years, yet investors in those funds earned less than 3% (Business Standard, 2022). The funds did not fail. Investors bought after the rally and sold or switched during the fall. That difference is the mutual fund behaviour gap. This article explains how it works, shows how large it is, and sets out a rule-based plan for the next 20% market fall.
What is the mutual fund behaviour gap?
The behaviour gap is the difference between a fund’s reported return and the return its investors actually earn. A fund’s NAV return is time-weighted, which removes the effect of when investors add or withdraw money. An investor’s XIRR is money-weighted, so it reflects the dates and sizes of your own purchases and redemptions. If investors add money after a rally and withdraw after a fall, XIRR ends up below the fund’s return even though the fund performed exactly as reported.
Why does the gap happen?
• Performance chasing: money flows into categories after strong trailing returns.
• Stopping SIPs in a fall: this removes purchases made at lower prices.
• Panic redemptions: these lock in losses before any recovery.
• Frequent switching: this adds exit loads and taxes.
What does the data show?
Studies in the US and India point the same way.
|
Source |
Finding |
|
DALBAR 2025 report (US) |
In 2024 the average equity investor earned 16.54% against 25.02% for the S&P 500. Over the 20 years to 2024 the figures were 9.24% and 10.35% a year. |
|
DALBAR 2026 report (US) |
In 2025 the gap narrowed to 0.72 percentage points (17.16% against 17.88%). |
|
Over 10 years to December 2024, the average dollar earned 7% a year against 8.2% for the funds, about 15% of returns lost. |
|
|
About 12% of aggregate returns lost over 10 years, roughly $3.8 trillion. |
|
|
Poorly timed purchases and withdrawals cost fund investors 1.56% a year against buy-and-hold. |
|
|
Technology funds: 27.5% three-year return, under 3% for investors. The gap is lower in diversified categories such as large-cap. |
|
|
Retail investors chased funds that later underperformed and earned up to 1.3% less in raw returns than institutional investors. |
Three cautions apply. Most of this data is from the US. DALBAR’s method has been criticised, so we show Morningstar’s dollar-weighted method alongside it. And the gap varies by year: it was small in DALBAR’s 2025 data. It is widest in sector and thematic funds, where recent returns pull money in.
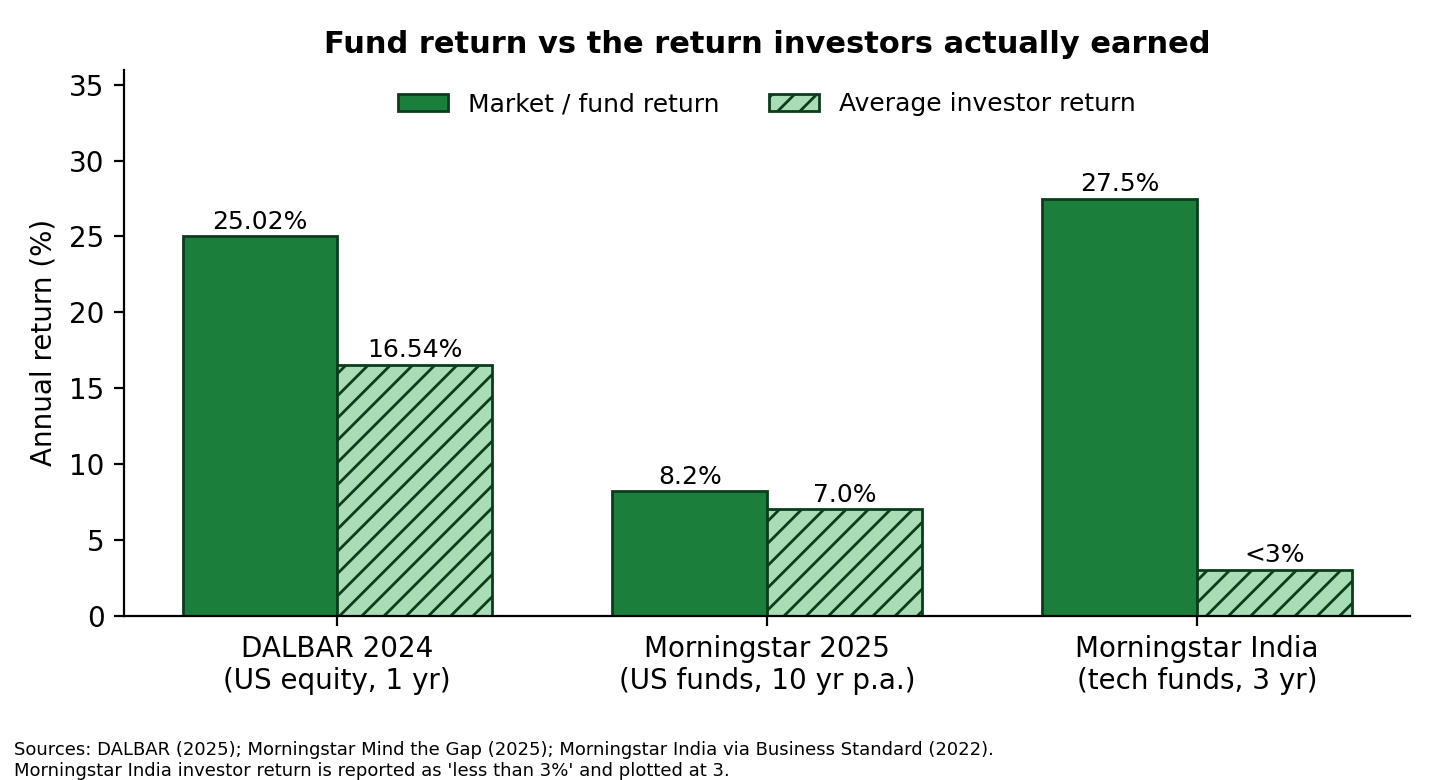
Figure 1. Fund or market return against average investor return. Sources: DALBAR, Morningstar, Business Standard.
What are Indian investors doing now?
AMFI data for August 2026 shows record SIP contributions of ₹32,297 crore and more than 10 crore contributing SIP accounts (Upstox). Small-cap funds took the largest net equity inflow at ₹7,973 crore, followed by mid-cap at ₹6,989 crore (DD India). The SIP stoppage ratio was above 100% in March and April 2026 and 81.9% in July. That ratio includes SIPs that completed their tenure, so it measures churn, not only panic. Heavy flows into the most volatile categories are where the studies find the widest gaps. Flows alone do not prove a gap in this cycle. Your own XIRR does.
Worked example: a ₹10,000 SIP through March 2020
This illustration uses approximate Nifty 50 month-end levels from January 2020 to December 2021. It is a price index, so it ignores dividends, fund expenses and taxes. Each investor starts a ₹10,000 monthly SIP in January 2020.
|
Investor |
Behaviour |
Invested |
Value, Dec 2021 |
XIRR |
|
A |
Continues for 24 months |
₹2,40,000 |
₹3,25,594 |
32.4% |
|
B |
Stops for six instalments (Mar to Aug 2020), then resumes |
₹1,80,000 |
₹2,21,684 |
26.7% |
|
C |
Redeems everything on 1 April 2020 and stays in cash |
₹30,000 |
₹21,930 |
Loss of 26.9% |
Investor B invested ₹60,000 less than A, but the cost is larger than that. The six skipped instalments were bought near the cycle low, and they would have grown to ₹1,03,910 by December 2021, a gain of 73%. B’s XIRR is 5.7 percentage points below A’s.
The example also shows why the benchmark matters. The index’s point-to-point CAGR over the two years was about 19.4%, yet A earned 32.4% XIRR because SIP buying at low prices lifted the money-weighted return. Comparing a SIP investor’s XIRR with a fund’s CAGR gives a false reading in either direction.
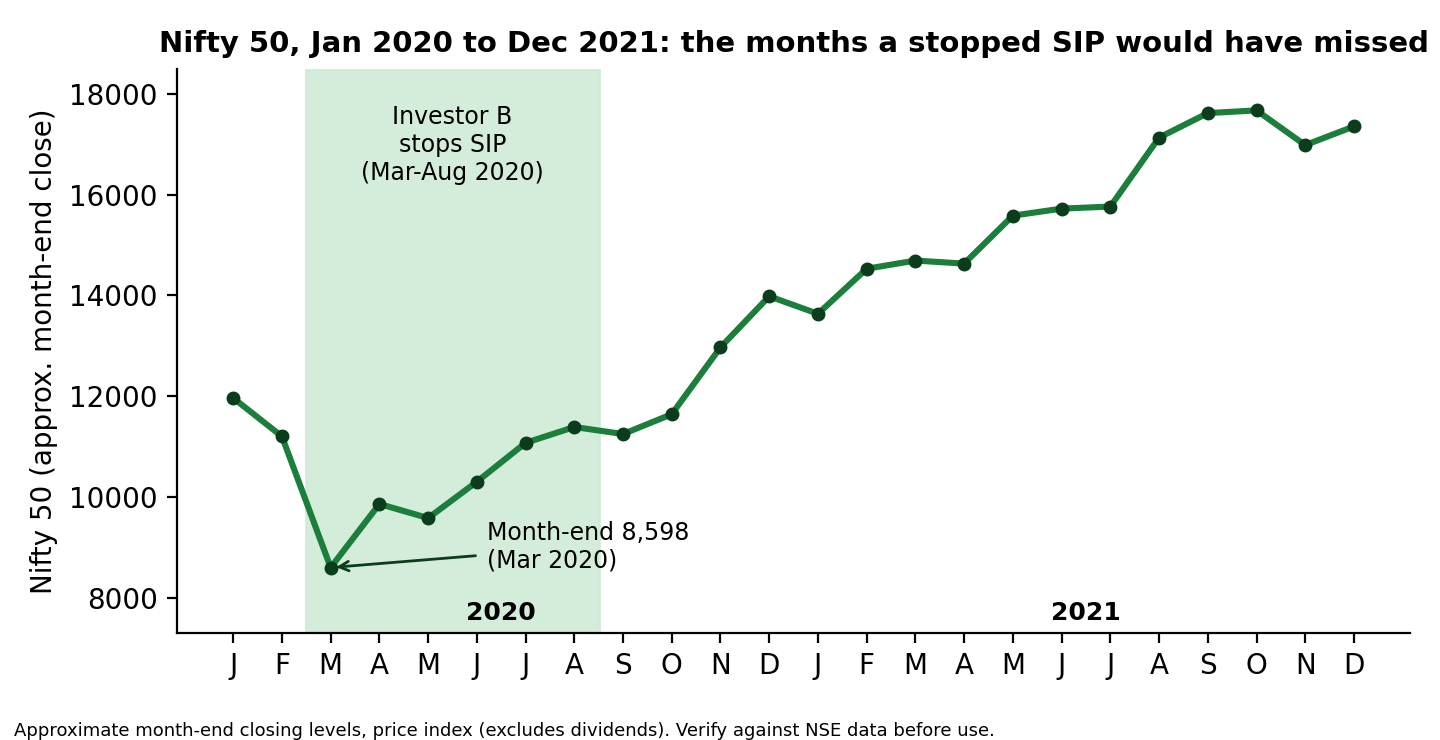
Figure 2. The shaded months are the instalments Investor B skipped. Approximate month-end levels; verify against NSE data.
Two limits apply. The 2020 recovery was unusually fast: the Nifty fell about 38% in 33 sessions and regained its losses by November 2020 (Equities India). The 2008-09 fall was close to 60% (Stable Investor). A plan must survive the second case, not only the first.
How do you measure your own behaviour gap?
1. Download your consolidated account statement from MF Central or the registrars and note the XIRR of each folio.
2. Build a benchmark. Invest the same amounts on the same dates in the same fund, or its index, using NAV history, and calculate XIRR in Excel.
3. Subtract. A negative result is the cost of your cash-flow timing. For a lump sum, compare with the fund’s CAGR over your holding dates. For a SIP, never compare XIRR with point-to-point CAGR.
What should you do when the market falls 20%?
Write the rules before the fall. In six earlier Nifty declines of 20% or more, the fall stopped near 20% only once, so a 20% fall can deepen.
1. Fix the allocation in writing: target split, a rebalancing band (for example, plus or minus 5 percentage points) and review dates.
2. Match money to time: keep money needed within about three years in debt or liquid funds, so you are not forced to sell equity.
3. Continue SIPs. If cash flow allows, agree a step-up in advance.
4. Rebalance only on rule. If equity falls below the band, buy using fresh cash first. If it rises above, trim.
5. Price the exit first. Equity gains within 12 months are taxed at 20%. Gains after 12 months are taxed at 12.5% above ₹1.25 lakh a year (Tata Mutual Fund). Exit loads may also apply.
6. Pause for 48 hours before any sale not triggered by a rule, and review it with your adviser.
Selling also risks missing recoveries. For the S&P 500 from February 1994 to January 2024, missing the 30 best days cut the annual return from 8.0% to 1.8% (Wells Fargo Investment Institute).
Where do AI tools help, and where do they not?
AI tools are useful for screening funds, checking portfolio overlap and comparing costs. They do not change what you do when the portfolio falls. Fund selection is one decision. Discipline is repeated every quarter. Structure closes the gap: automated SIP mandates, a written allocation policy, pre-set rebalancing bands and a person who asks you to check the plan before you act. Morningstar’s takeaway is to trade less and automate where possible. Doing nothing is not always right, though. Rebalancing by rule, or changing the plan when your goals, income or time horizon change, is legitimate. Selling because the screen is red is not.
How SJS Finserve works
1. Goals and risk profile.
2. Target allocation and a written policy with rebalancing bands.
3. Fund selection and implementation through SIP mandates.
4. Quarterly review of XIRR against a benchmark SIP, plus a rebalancing check.
Get a portfolio review
Book a free 30-minute consultation with SJS Finserve to review your current investments, understand your goals, and get guidance on investing, financial planning, and managing your wealth effectively.
Frequently asked questions
Should I stop my SIP when the market falls?
Usually not. A SIP buys more units at lower prices. In the example above, the six skipped instalments grew 73%. Stop only if your goal, income or time horizon has changed.
What is the difference between XIRR and CAGR?
CAGR measures growth between two dates for one amount. XIRR handles several investments and withdrawals on different dates, so it suits SIPs.
Is a 20% fall a reason to sell?
Only if a pre-set rule says so or your goal or time horizon has changed. Check tax and exit load first.
Can SJS Finserve help me decide how much to invest every month?
Yes. SJS Finserve can help determine an appropriate SIP based on your income, goals, investment horizon and financial capacity.
What does SJS Finserve do for my existing investments?
SJS Finserve reviews your current investments, goals and risk profile to help create a more structured and disciplined investment strategy.
How can SJS Finserve help me manage my wealth?
SJS Finserve helps you align your investments, savings, insurance and financial goals to build a more structured long-term wealth plan.