The Nifty 50 is showing a pattern investors have been waiting for: higher highs and higher lows. But does that mean the correction is over, or is the market simply becoming less weak?
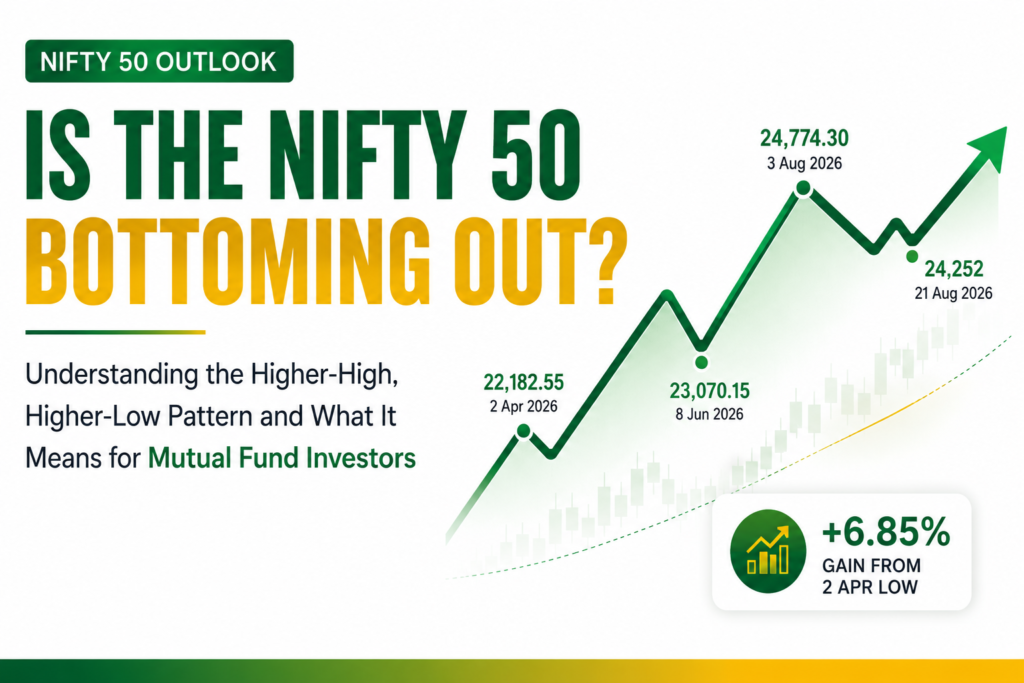
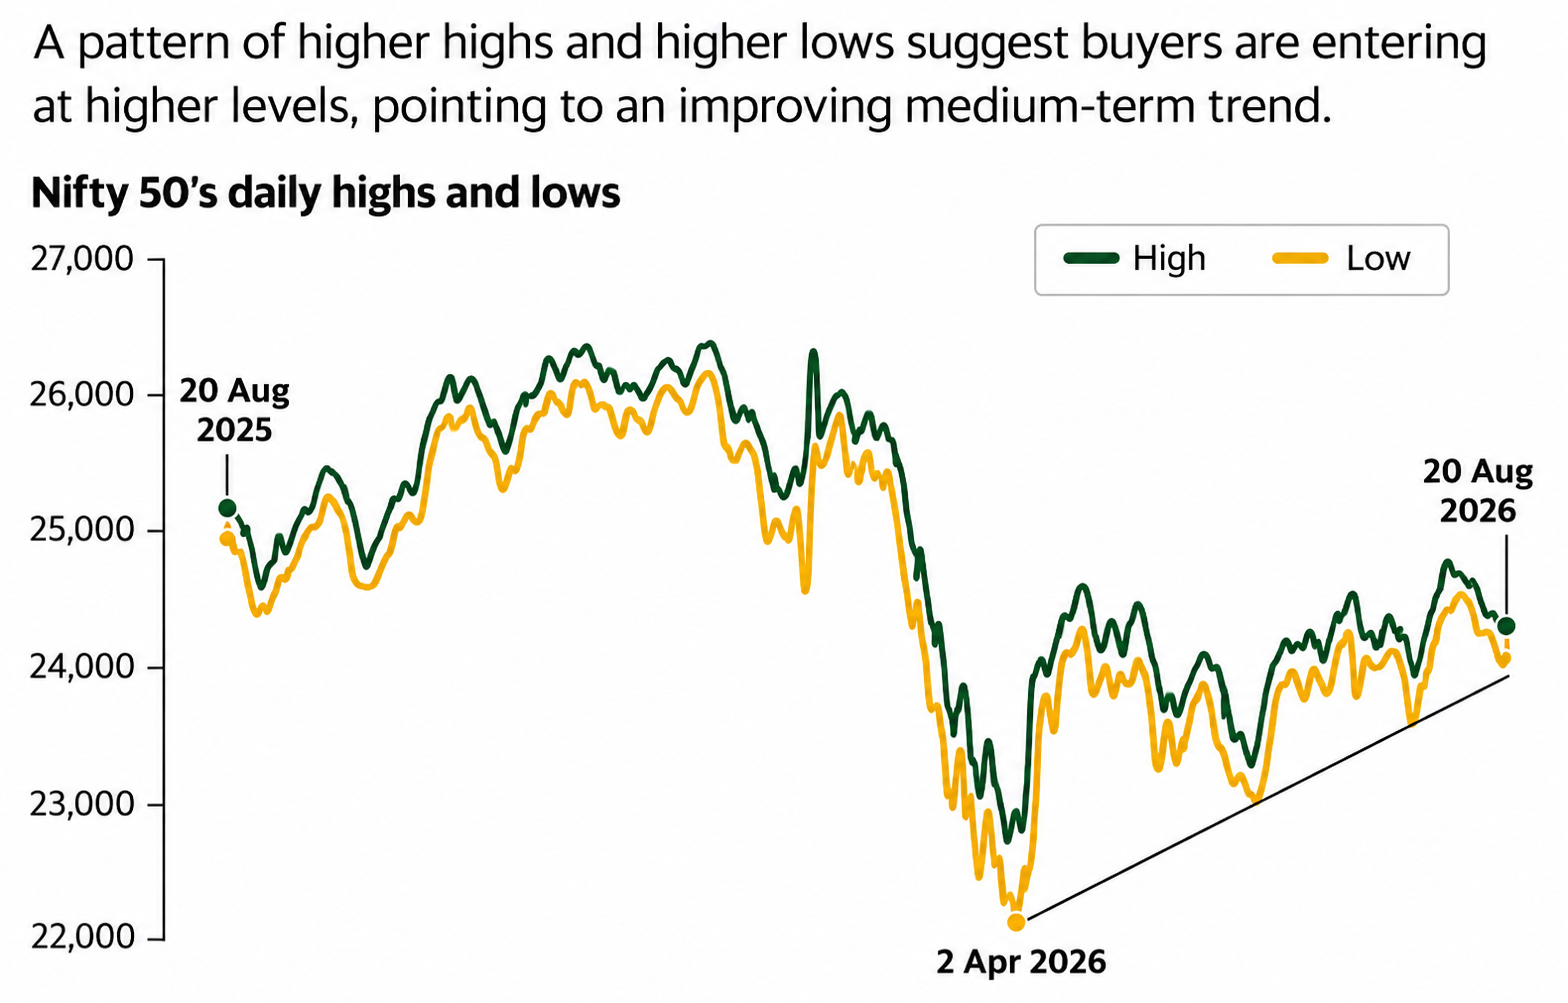
After falling to 22,182.55 on 2 April 2026, the Nifty 50 has gradually rebuilt its market structure. The index came close to its April low on 8 June, but stopped at 23,070.15, creating a higher low. It then moved above its 2 April intraday high of 22,782.30 and eventually reached 24,774.30 on 3 August.
By 21 August 2026, the Nifty had closed at 24,252, compared with 24,231.85 on the previous trading day. From the April low, the index had gained 6.85%.
The numbers are encouraging. But the more important development is the structure behind them.
Nifty 50’s higher-high, higher-low structure since the April 2026 low
< /p>
/p>
Source: Live Mint
What does a higher-high, higher-low pattern mean?
A market does not need to rise every day to become more constructive.
One of the more useful signals is what happens when investors step in during corrections. If each subsequent decline finds support at a level higher than the previous low, it suggests buyers are becoming comfortable entering the market at progressively higher prices.
That is what the current Nifty structure is showing.
The April low was 22,182.55. The June low was 23,070.15, well above the April level. The index then went on to record a high of 24,774.30 on 3 August.
The sequence is therefore more important than any single number:
22,182.55 → 23,070.15 → 24,774.30
The first move shows the market recovering from its April low. The second shows that the next significant correction did not take the index back to that low. The subsequent high shows that buyers were able to push the market into a higher price zone.
This is why the current structure is being interpreted as a possible improvement in the medium-term trend. The original Mint report similarly notes that the pattern suggests buyers are entering at higher levels and that the Nifty may be moving out of its corrective phase. At the same time, the analysts quoted in the report caution that it is still too early to call this a sustained uptrend.
That last point is particularly important for investors.
An improving trend is not the same thing as a confirmed bull market.
Key Nifty 50 levels from April to August 2026
The recent market movement can be reduced to a few important data points.
|
Date |
Nifty 50 level |
What it tells us |
|
2 April 2026 |
22,182.55 |
April low |
|
2 April 2026 |
22,782.30 |
April intraday high |
|
8 June 2026 |
23,070.15 |
Higher low |
|
3 August 2026 |
24,774.30 |
Higher high |
|
21 August 2026 |
24,252 |
Level after subsequent correction |
The Nifty’s 21 August close was 24,252, while the previous close was 24,231.85. The index had therefore remained substantially above its April low even after experiencing another period of weakness.
For investors, this is arguably more useful than focusing on whether the index gained or lost a few points on any individual day.
The broader question is whether corrections continue to produce higher support levels.
That is the signal worth watching.
Why the recovery matters despite a difficult market backdrop
The current market structure becomes more interesting because it has developed without a corresponding improvement in every major macro signal.
The Mint report points to several pressures that have remained in the background, including rising crude oil prices, geopolitical tensions, higher US and Japanese bond yields, a stronger dollar against the rupee and relatively weak foreign institutional flows.
That creates an important market contradiction.
The Nifty is showing greater resilience even though the overall news environment has not become significantly more favourable.
This is often where investors need to look beyond headlines.
A market that continues to find buyers despite difficult news may be signalling that investors are becoming more comfortable absorbing those risks. It can also indicate that domestic liquidity is providing support even while foreign investors remain cautious.
But resilience should not be confused with immunity.
If crude oil rises further, global yields remain under pressure or geopolitical risks intensify, the constructive technical structure could still face renewed selling pressure.
So the right conclusion is not that the risks have disappeared.
It is that the market is currently absorbing those risks better than it was earlier in the correction.
FII flows are improving, but the bigger picture remains mixed
Institutional flows provide another important piece of the story.
According to the Mint report, FIIs had turned net buyers and purchased ₹45,796 crore worth of Indian equities in July and August so far.
However, the broader picture remains more complicated.
Since April, FIIs had still net sold ₹1.09 trillion, while DIIs had net bought ₹2.8 trillion.
|
Institutional flow |
Amount reported |
|
FII purchases in July and August so far |
₹45,796 crore |
|
FII net selling since April |
₹1.09 trillion |
|
DII net buying since April |
₹2.8 trillion |
This difference matters.
A change from selling to buying by foreign investors can support the market and improve sentiment. But the cumulative numbers show that domestic institutional buying has also been an important source of support.
For investors, institutional flows are therefore best treated as a confirmation signal, not as a standalone investment trigger.
The question is whether the improvement in FII participation persists while domestic liquidity remains supportive.
What can history tell us about the current Nifty structure?
The current setup is not without historical parallels.
The Mint report highlights similar higher-top and higher-bottom formations in 2012 and 2018, following periods of correction and consolidation.
In 2012, the Nifty touched approximately 4,770.35 on 4 June. The index subsequently developed a sequence of higher highs and higher lows and gained 21.97% from its 4 June low to the end of that calendar year.
In 2018, the Nifty touched 10,004.55 on 26 October. The index subsequently gained 14% over the following year, although the journey included intermittent corrections and periods of consolidation.
|
Historical period |
Starting point highlighted |
Subsequent performance highlighted |
|
2012 |
4,770.35 on 4 June |
21.97% gain to year-end |
|
2018 |
10,004.55 on 26 October |
14% gain over following year |
|
2026 |
22,182.55 on 2 April |
6.85% gain as of 21 August |
The purpose of these comparisons is not to suggest that 2026 will replicate either historical episode.
That would be a dangerous way to use historical data.
Markets operate within different economic, valuation, liquidity and geopolitical conditions. A similar chart pattern does not produce identical outcomes.
The more useful lesson is that a transition from lower lows towards higher lows and higher highs has previously accompanied periods of improving market structure.
That makes the current development worth monitoring, not blindly following.
Is this a good time to invest in mutual funds?
This is where the discussion changes for a long-term investor. Someone trading the Nifty may ask whether the index has crossed a particular resistance level. A mutual fund investor should ask a different question:
Does my portfolio make sense for my financial goals if the market continues higher, and does it remain appropriate if another correction occurs?
That is a much more important question because financial freedom is not created by correctly predicting one market phase. It is created by consistently allocating capital, staying invested through appropriate periods of volatility and maintaining a portfolio that matches the investor’s objectives and risk capacity.
The current Nifty structure can therefore be useful information without becoming an investment instruction. An investor does not need to decide that a bull market has officially begun before investing.
Equally, an investor should not dramatically increase equity exposure simply because the Nifty has recovered from its April low. The right response depends on the portfolio.
What matters now for mutual fund investors
For investors building long-term wealth through mutual funds, four signals deserve particular attention.
- First, watch the higher-low structure. If future corrections continue to hold above previous important lows, the constructive interpretation becomes stronger.
- Second, watch whether the Nifty can sustain higher highs. A market that repeatedly fails around previous highs would tell a different story from one that continues to establish new highs.
- Third, monitor institutional flows. The shift to ₹45,796 crore of FII buying in July and August so far is worth watching, particularly against the broader ₹1.09 trillion of FII net selling since April.
- Fourth, keep macro risks in perspective. Crude oil, geopolitical tensions, global bond yields and currency movements can still change market sentiment quickly.
The important point is that none of these signals should automatically result in a portfolio transaction. They should instead inform a broader portfolio review.
What does not matter as much as the headlines suggest?
The daily Nifty level matters less than investors often assume. A one-day move from 24,231.85 to 24,252 does not change a long-term financial plan.
Similarly, declaring the beginning of a bull market because an index has moved higher can encourage investors to make decisions based on recent performance rather than future requirements.
For someone investing towards retirement, a child’s education or long-term financial independence, the more relevant questions are:
- Is the portfolio diversified appropriately?
- Is the equity allocation consistent with the investor’s risk capacity?
- Are the investments connected to identifiable financial goals?
- Is the investor prepared to remain invested through another correction?
- Does the current portfolio still make sense if market returns are lower or more volatile than expected?
This is also why investors should distinguish between market analysis and portfolio management. A market chart can tell us something about market behaviour. It cannot tell us how much equity an individual investor should own.
The portfolio decision is more important than the market prediction
The current Nifty structure may be encouraging. But investors should resist turning that observation into a binary decision: either invest aggressively because the bull market has arrived, or wait entirely for confirmation.
Long-term investing rarely requires such certainty.
For an investor with an appropriate mutual fund portfolio, a period of improving market structure can simply reinforce the value of remaining disciplined.
For someone holding excessive cash, the right question is whether the cash is intentional or simply the result of waiting for a market entry point that may never feel comfortable.
For someone whose portfolio has become too concentrated, a market recovery may be an appropriate time to reassess the overall allocation.
And for an investor whose goals, income, time horizon or risk capacity have changed, the portfolio may require a review regardless of where the Nifty is trading.
This is why the objective should not be to predict the next Nifty move.
The objective should be to build a portfolio that can withstand uncertainty while participating in long-term economic growth.
What should investors monitor next?
The Nifty has given investors a constructive signal, but the next phase needs confirmation. The key question is whether the market can continue producing higher highs and higher lows. If it does, the current improvement in market structure becomes more credible.
If the index breaks down through important previous lows and the sequence of higher lows is disrupted, the bullish interpretation would need to be reconsidered.
Institutional flows will also remain important. The recent FII buying is encouraging, but the cumulative numbers show that foreign participation has not completely reversed its earlier selling trend.
If you want to understand whether your mutual fund portfolio remains aligned with your financial goals, risk profile and investment horizon, SJS Finserve can help you review your portfolio and make more informed long-term decisions as you work towards financial freedom.