1. Start With Your Financial Goal
What am I investing for, and when will I need the money?
This should be the first question you answer before looking at any mutual fund.
A fund suitable for a long-term retirement goal may not be appropriate for money you need in the next two or three years. Your investment horizon determines how much market volatility you may have time to tolerate.
For example, equity-oriented schemes are generally intended for investors with a longer-term outlook and carry higher market risk. Debt-oriented schemes have different risk characteristics, while hybrid funds combine different asset classes. SEBI’s investor education material also highlights the importance of considering risk-taking capacity, financial position and investment objective when selecting between equity and debt-oriented schemes.
The simple rule is: goal first, fund selection second.
2. Choose the Right Mutual Fund Category
Should I compare all mutual funds with each other?
No. Start by choosing the appropriate category.
Common mutual fund categories include:
- Equity funds
- Debt funds
- Hybrid funds
- Index funds
These categories have different investment objectives and risk characteristics. For example, index funds aim to replicate a particular index, while equity-oriented schemes primarily invest in equities.
For a beginner, it is usually more useful to compare funds within a similar category rather than comparing completely different types of funds.
If you want to understand the different categories in more detail, see the types of mutual funds in India guide.
3. Check Past Performance
Is a fund with the highest recent return the best fund?
Not necessarily.
One of the biggest mistakes investors make is chasing the mutual fund that performed best during the previous year.
Instead, look at performance over longer periods such as 3 years and 5 years. Depending on the investment and the information available, investors can also review longer-term and rolling returns.
The purpose is not simply to find the highest return. You want to understand how consistently the fund has performed across different market conditions.
SEBI’s investor education material notes that investors can compare performance over periods including 1, 3 and 5 years and compare schemes with other funds having similar investment objectives and with relevant benchmarks. It also clearly states that past performance does not indicate future performance.
What about CAGR and XIRR?
CAGR and XIRR are two commonly used ways to understand investment returns. CAGR is useful for understanding the annualised growth of a lump-sum investment over a period. XIRR is particularly useful when there are multiple investments or withdrawals at different dates, such as SIP investments.
The important point is to use the right return measure for the type of investment you are evaluating.
4. Evaluate the Fund Manager
Who is managing the fund?
The fund manager is responsible for making investment decisions within the fund’s stated strategy.
Look at:
- How long the current manager has managed the fund
- Experience across different market cycles
- Consistency in following the fund’s investment approach
- How the fund has behaved during difficult market periods
A manager change does not automatically make a fund unsuitable. However, it is important to understand who generated the historical performance you are reviewing.
SEBI specifically identifies the educational qualifications and work experience of key personnel, including fund managers, as information investors should review in scheme documents.
5. Understand the Fund’s Portfolio
What does the mutual fund actually own?
A fund’s name alone does not tell you everything about its risk. Review its portfolio to understand where your money is actually being invested.
For equity funds, look at:
- Major holdings
- Sector allocation
- Large-cap, mid-cap and small-cap exposure
- Concentration in individual companies
For debt funds, review the quality and type of debt instruments held.
A highly concentrated portfolio can behave differently from a diversified portfolio. The important question is whether the portfolio is consistent with the fund’s objective and your risk tolerance.
SEBI notes that scheme portfolio information can show investments across equities, debentures, money market instruments and government securities, along with the percentage of the scheme’s NAV represented by each investment.
6. Check the Risk Level
How much volatility can I realistically handle?
Investors often focus on returns and ignore the experience of getting those returns.
A fund that generates strong returns but regularly experiences large declines may be difficult to hold during a market correction. This is where your own behaviour matters.
If a 20% or 30% temporary decline would make you panic and sell, choosing a highly volatile fund may create a bigger problem than simply selecting a lower-risk investment from the beginning.
SEBI advises investors to compare risks and expected yields and to consider their own risk-taking capacity when making investment decisions.
7. Understand Alpha, Beta and Sharpe Ratio
What do these mutual fund ratios actually mean?
You do not need to become a financial analyst to understand the basic meaning of these ratios.
| Ratio | What it tells you | Simple interpretation |
|---|---|---|
| Alpha | Fund performance compared with its benchmark | Positive alpha indicates performance above the benchmark |
| Beta | Sensitivity to market movements | Around 1 means movement broadly similar to the market |
| Sharpe Ratio | Return relative to risk taken | Higher indicates relatively better return for the risk taken |
Alpha can help you understand how the fund has performed relative to its benchmark. Beta helps you understand how strongly the fund has historically moved with the market. The Sharpe ratio helps compare returns relative to the amount of risk taken.
These ratios should be used for comparison and context. They should not become the sole reason for selecting a fund.
8. Check the Expense Ratio
What is an expense ratio in a mutual fund?
The expense ratio represents the expenses charged to operate and manage the mutual fund scheme. These costs affect the return available to investors. Over a long investment period, costs deserve attention because even relatively small differences can affect the amount of wealth that compounds over time.
However, the lowest expense ratio does not automatically make a fund the best choice. Compare costs alongside performance, portfolio, risk and investment strategy.
You can also learn more about expense ratio, exit load and other mutual fund costs in this mutual fund costs guide.
9. Look at Portfolio Turnover
How often does the fund buy and sell investments?
Portfolio turnover gives you an idea of how frequently the fund changes its holdings.
| Turnover | What it may indicate |
| Lower turnover | Longer holding periods |
| Higher turnover | More frequent portfolio changes |
A high turnover ratio is not automatically negative. Some investment strategies require frequent changes.
Instead, use turnover to understand the fund’s investment style. If a fund follows a long-term investment approach but has unusually high turnover, understand what is driving the activity.
10. Compare the Fund With Its Benchmark
Did the fund actually outperform its benchmark?
A fund’s return means more when you compare it with an appropriate benchmark. Suppose a fund generated a 12% return. That sounds attractive until you discover that its benchmark generated 15% during the same period. The reverse can also happen. A fund generating 12% while its benchmark generated 10% deserves a different interpretation.
The comparison should be made across appropriate periods rather than relying on one year’s performance. SEBI recommends comparing mutual fund schemes with other schemes having similar investment objectives and with relevant benchmarks.
11. Check the Fund House
Does the fund house’s reputation matter?
The fund house manages the investment operation behind the scheme, so its governance, transparency and overall investment practices deserve attention.
Review:
- Track record across schemes
- Governance and transparency
- Investment processes
- Consistency in managing funds
- Relevant disclosures
However, a well-known fund house does not automatically make every scheme suitable. The individual fund still needs to pass your evaluation checklist.
For official mutual fund information, investors can refer to the AMFI website, which provides information including NAV, fund performance and mutual fund industry data.
12. Understand NAV
Does a lower NAV mean a mutual fund is cheaper?
No. This is a common misconception among new investors. A mutual fund with an NAV of ₹20 is not automatically cheaper or better than another fund with an NAV of ₹100. NAV represents the per-unit value of a mutual fund scheme. AMFI defines NAV as the per-unit market value of a mutual fund.
SEBI also explains that investors should not select a scheme simply because it has a lower NAV. The number of units you receive does not determine the return you will earn. What matters is how the investment performs after you invest.
For a simple explanation of NAV, see the NAV in mutual funds guide.
13. Check Exit Load and Liquidity
Can I withdraw my money whenever I want?
Do not assume that every mutual fund investment can be withdrawn without conditions. Check whether the scheme has an exit load for redemption within a specified period. Some categories can also have lock-in periods.
For example, ELSS is a tax-saving mutual fund category with a mandatory three-year lock-in period.
SEBI explains that investors should review entry and exit loads as part of the scheme’s offer documents. Understanding liquidity is particularly important when you are investing money that may be needed for a specific financial goal.
14. Understand the Tax Implications
Does the tax treatment depend on the mutual fund?
Yes.
Tax treatment can differ depending on the type of mutual fund, the nature of the gain and the holding period. Tax rules can also change. Before investing, understand the tax implications that apply to the specific fund you are considering.
For current capital gains information, investors can refer to the Income Tax Department’s capital gains guidance and its guidance on short-term capital gains. For long-term capital gains, refer to the Income Tax Department’s long-term capital gains guidance. General information is also available through the Income Tax Department’s capital gains FAQs.
Tax rules are subject to change. For decisions involving your individual tax position, consult a qualified tax professional.
15. Review the Fund’s Role in Your Portfolio
Why am I adding this particular fund?
This question is often overlooked.
Before adding a mutual fund, understand what role it plays in your existing portfolio.
For example, if you already have several equity funds investing in similar companies and sectors, adding another similar fund may not provide as much diversification as you expect.
A new fund should have a clear purpose.
Ask:
- What asset class does it provide?
- What market segment does it cover?
- Does it add meaningful diversification?
- Does it overlap significantly with my existing funds?
- Does it support a specific financial goal?
The objective is not to own as many mutual funds as possible. The objective is to build an investment portfolio that makes sense for your financial goals.
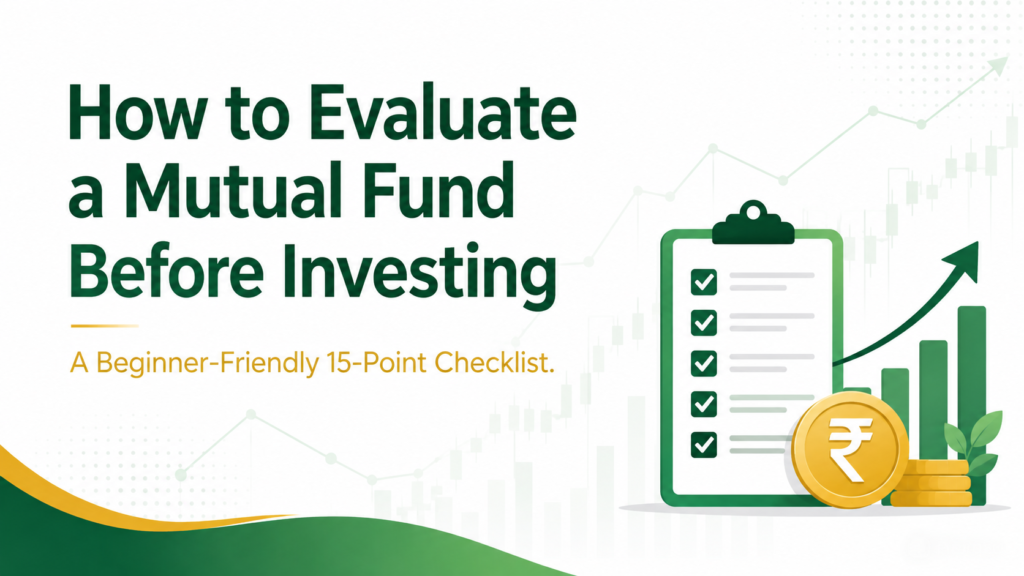
A Simple Mutual Fund Evaluation Checklist
If you are a beginner, you can reduce the entire evaluation process to these questions:
| Factor | What to check |
| Financial goal | What am I investing for? |
| Time horizon | When will I need the money? |
| Fund category | Does the category match my objective? |
| Performance | How has the fund performed over 3 and 5 years? |
| Fund manager | Who manages the fund and for how long? |
| Portfolio | What does the fund actually own? |
| Risk | Can I handle its fluctuations? |
| Alpha | How has it performed against the benchmark? |
| Beta | How sensitive is it to market movements? |
| Sharpe ratio | How efficiently has it generated returns relative to risk? |
| Expense ratio | What does the fund cost? |
| Turnover | How frequently does the portfolio change? |
| Benchmark | How does it compare with the relevant index? |
| NAV | Am I avoiding the mistake of choosing based on NAV alone? |
| Exit load | Are there charges for early redemption? |
| Taxation | What tax rules apply? |
| Portfolio role | Does this fund add useful exposure? |
No fund needs to score perfectly on every factor.
The purpose of the checklist is to help you understand the fund before investing rather than making a decision based on one attractive number.
How to Start a SIP After Selecting a Fund
Once you have identified a suitable mutual fund, the next step is to set up your investment.
For beginners, the process can be kept simple:
- Define your financial goal.
- Decide your investment horizon and risk comfort.
- Select the appropriate mutual fund category.
- Compare suitable funds within that category.
- Review the fund’s performance, portfolio, costs and risk.
- Complete the required KYC process.
- Choose the appropriate investment plan and option.
- Select your SIP amount and investment date.
- Set up the required payment mandate.
- Review the investment periodically against your financial goals.
If you are new to mutual funds, you can also read this simple guide to mutual funds for first-time investors.
Start with your goal and time horizon. Then select the appropriate category. After that, evaluate performance, portfolio quality, fund manager, risk, costs and benchmark performance.
For official investor information, you can also refer to SEBI’s investor education material on mutual funds and AMFI’s investor resources.
If you are unsure whether a particular mutual fund fits your financial goals, risk profile and existing portfolio, a structured review can help you make a more informed decision. You can book a free consultation with SJS Finserve to discuss your financial and investment requirements.
FAQs
What is a good expense ratio for a mutual fund?
There is no single expense ratio that is automatically good for every mutual fund. Compare costs with other funds in the same category and consider the fund’s investment strategy, performance, portfolio and risk.
How much return should I expect from a mutual fund?
There is no guaranteed return from a market-linked mutual fund. Historical returns can help you understand how a fund has performed in the past, but they should not be treated as a promise of future performance.
What is the Sharpe ratio in a mutual fund?
The Sharpe ratio helps assess the return generated by a fund relative to the risk taken. A relatively higher Sharpe ratio indicates better return for the level of risk when comparing appropriate funds.
What is alpha in a mutual fund?
Alpha indicates the difference between a fund’s return and the return of its benchmark. A positive alpha indicates that the fund has generated a return above its benchmark over the period being measured.
What is beta in a mutual fund?
Beta indicates how sensitive a fund’s returns have historically been to movements in its benchmark or market. A beta around 1 indicates movement broadly similar to the market, while a beta above 1 indicates greater sensitivity.
What is downside capture ratio?
Downside capture ratio helps investors understand how a fund has historically performed during periods when its benchmark declined. A ratio below 100 indicates that the fund captured less of the benchmark’s downside during those periods.