 SIF
SIF
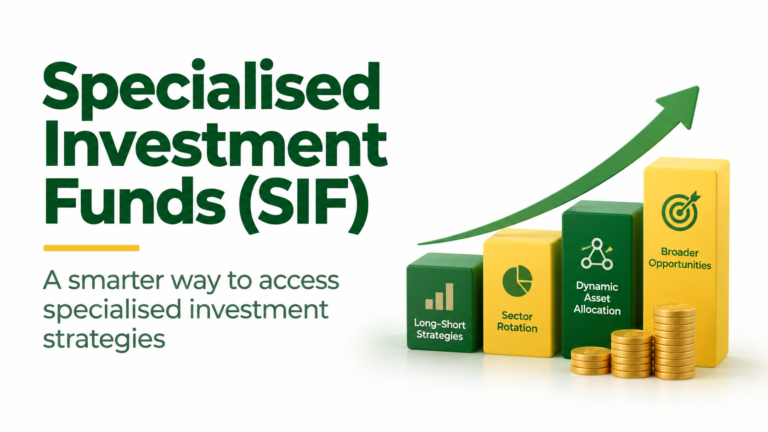
Specialised Investment Funds (SIF) Explained: The New Middle Ground Between Mutual Funds and PMS
A practical breakdown of SEBI's new SIF category minimum investment, strategies, risk, liquidity and taxation and how it compares to…


Investors put ₹29,329 crore into equity mutual funds in August, almost 19% more than the ₹24,697 crore recorded in July. But the headline number does not capture the more important shift within the market.
Small-cap funds attracted ₹7,973 crore, mid-cap funds received ₹6,989 crore, while large-cap funds recorded a ₹1,147 crore outflow for the second consecutive month. Flexi-cap funds also saw inflows rise to ₹5,059 crore from ₹4,709 crore in July.
The pattern is a continuation of what we highlighted in our July 2026 mutual fund flow analysis. The difference is that August provides another month of evidence that investor allocations are moving strongly toward mid- and small-cap funds while large-cap funds remain under pressure.
For investors, the portfolio question is straightforward: has your own allocation moved in the same direction, even if you did not consciously increase your mid- or small-cap exposure?
The category-level numbers show where the new money went.
| Equity fund category | July 2026 | August 2026 |
|---|---|---|
| Small-cap | ₹7,768 crore | ₹7,973 crore |
| Mid-cap | ₹6,192 crore | ₹6,989 crore |
| Flexi-cap | ₹4,709 crore | ₹5,059 crore |
| Large & Mid-cap | ₹3,425 crore | ₹3,873 crore |
| Multi-cap | ₹3,227 crore | ₹3,733 crore |
| Large-cap | -₹1,322 crore | -₹1,147 crore |
| Total equity | ₹24,697 crore | ₹29,329 crore |
Source: AMFI data as reported following the August 2026 monthly release.
Small-cap inflows increased from ₹7,768 crore in July to ₹7,973 crore in August. Mid-cap inflows rose from ₹6,192 crore to ₹6,989 crore.
Combined, the two categories attracted ₹14,962 crore in August. That is roughly 51% of the ₹29,329 crore total equity mutual fund inflow. This is the clearest portfolio signal in the data. More than half of the net money entering equity mutual funds went into small-cap and mid-cap categories.
Large-cap funds moved in the opposite direction, with ₹1,147 crore leaving the category after a ₹1,322 crore outflow in July. The result is a widening difference in investor preference between the two ends of the market-cap spectrum.
The broader equity flow numbers provide useful context.
| Month | Gross equity MF investments | Net equity MF inflows |
|---|---|---|
| April 2026 | ₹70,302 crore | ₹38,440 crore |
| May 2026 | ₹57,604 crore | ₹22,908 crore |
| June 2026 | ₹67,601 crore | ₹28,973 crore |
| July 2026 | ₹69,522 crore | ₹24,697 crore |
| August 2026 | ₹73,614 crore | ₹29,329 crore |
August recorded the highest net equity mutual fund inflow since April. Gross investments also increased to ₹73,614 crore. The category numbers are more revealing than the aggregate number, however.
In July, equity mutual fund inflows had fallen to ₹24,697 crore, yet small-cap and mid-cap funds still attracted ₹13,960 crore combined. In August, their combined inflow increased to ₹14,962 crore. The preference therefore persisted even as overall equity flows moved between months.
That changes the portfolio question from whether investors are participating in equities to how much of that participation is being directed toward smaller companies.
This is where investors need to look beyond individual fund names.
Suppose an investor originally constructed a portfolio with a defined allocation between large-cap, mid-cap and small-cap funds. If subsequent SIPs are directed disproportionately toward small-cap funds, the portfolio’s market-cap mix changes.
The investor may not have made a conscious decision to take more small-cap risk. The allocation changed because of where the new money went. The same thing can happen through performance.
If small-cap holdings appreciate faster than large-cap holdings, their percentage of the portfolio increases even if the investor makes no additional purchase. That creates allocation drift. The issue is not that small-cap exposure should be avoided. It is that the exposure should remain consistent with the risk level the investor originally intended to take.
Our July analysis illustrated this using a ₹10 lakh portfolio. The August data gives investors another reason to perform the same check on their own holdings.
Instead of asking whether a particular small-cap fund is attractive because it is receiving strong inflows, investors should first calculate their total small-cap and mid-cap exposure across every fund they own.
A portfolio containing three different schemes can still have a concentrated market-cap allocation.
Large-cap funds recorded a ₹1,147 crore net outflow in August after losing ₹1,322 crore in July. This is the second consecutive month of outflows from the category.
The data does not establish that money leaving large-cap funds is moving directly into small-cap funds. Investors can switch between categories, redeem without reinvesting, or move money into other equity categories.
But the contrast in flows is clear. While large-cap funds experienced two consecutive months of net outflows, small-cap and mid-cap funds recorded strong inflows in both July and August.
That creates a portfolio risk worth checking: investors may be reducing the allocation to one category while increasing exposure to another without considering how the overall risk profile has changed.
For someone whose portfolio was originally designed around a particular balance between stability and growth, replacing large-cap exposure with increasingly smaller companies can materially change the portfolio’s behaviour during a market correction.
The appropriate response is therefore not to follow the direction of the flows. It is to compare the current allocation with the allocation the portfolio was designed to maintain.
New fund offerings also increased in August.
Six active equity funds completed their NFO period during August and together collected ₹3,051 crore. In July, three equity NFOs had collected ₹768 crore.
The August NFO amount represented about 10.4% of the ₹29,329 crore net equity mutual fund inflow. That is large enough to mention, but not large enough to replace the category-flow story.
The stronger signal remains the ₹14,962 crore combined inflow into small-cap and mid-cap funds. NFO activity added to August’s equity collections, while existing small-cap and mid-cap categories continued to account for the largest portion of the flow.
The comparison with July is also useful. NFO mobilisation increased sharply from ₹768 crore among three equity NFOs in July to ₹3,051 crore across six active equity NFOs in August. That contributed to the stronger monthly equity flow number, but it does not explain away the sustained demand for small- and mid-cap funds.
The August numbers provide a simple portfolio test.
| Check this week | Question to answer |
|---|---|
| Small-cap allocation | What percentage of total equity is currently in small-cap funds? |
| Mid-cap allocation | Has the allocation increased since the original portfolio was created? |
| Large-cap allocation | Has it fallen below the intended level? |
| New SIPs | Are most new contributions going into the same market-cap segment? |
| Multiple funds | Do different schemes create overlapping exposure to the same segment? |
| Overall allocation | Does the current portfolio still match the original risk profile? |
This exercise should come before changing an SIP because of the latest AMFI flow data.
If an investor’s intended small-cap allocation was 15% but the actual allocation has moved materially above that level, adding another small-cap SIP simply because the category attracted ₹7,973 crore in August can increase concentration.
If the investor’s large-cap allocation has fallen below its intended level, the ₹1,147 crore category outflow is not a reason by itself to avoid large-cap exposure.
The decision should be based on the investor’s own portfolio structure.
The broader mutual fund industry continued to expand in August.
AMFI reported industry AUM of ₹87.08 lakh crore as of August 31, 2026, compared with ₹85.76 lakh crore at the end of July. The industry recorded 28.35 crore total folios, including about 21.62 crore folios under equity, hybrid and solution-oriented schemes.
The scale of retail participation makes category flows increasingly relevant to portfolio construction.
More households are using mutual funds to participate in equities, and the direction of those contributions can gradually change the composition of household portfolios.
But an industry flow number remains an industry statistic. The individual decision still comes down to whether the investor’s actual allocation matches the allocation required for their financial goals.
The complete monthly data is available through AMFI’s monthly data section, while the latest industry AUM and folio figures are published through AMFI’s Indian Mutual Fund Industry data.
The next set of AMFI numbers should answer three practical questions.
The third question is the one investors can act on immediately.
Before making another allocation, calculate the current percentage of your equity portfolio in large-cap, mid-cap and small-cap funds. Compare those percentages with your original investment plan.
If the gap is significant, rebalance the portfolio based on your financial objectives rather than increasing exposure to whichever category is currently attracting the most money.
August’s data shows a market where investor money is increasingly concentrated in smaller companies. Small-cap and mid-cap funds together attracted ₹14,962 crore, more than half of the month’s equity mutual fund inflows, while large-cap funds recorded their second consecutive monthly outflow.
For investors, the relevant decision is not whether small-cap or mid-cap funds are receiving more money.
It is whether their own portfolio has become more dependent on those segments than originally intended.
At SJS Finserve, portfolio decisions are built around the investor’s complete financial position rather than the latest monthly flow number. If you want an independent review of your mutual fund allocation, book a free consultation with SJS Finserve to assess whether your current portfolio still matches your goals, time horizon and risk capacity.
Small-cap mutual funds received ₹7,973 crore in net inflows in August 2026, compared with ₹7,768 crore in July.
Mid-cap funds attracted ₹6,989 crore in August, compared with ₹6,192 crore in July.
Yes. Large-cap funds recorded a ₹1,147 crore net outflow in August, following a ₹1,322 crore outflow in July.
Six active equity funds completed their NFO period in August and collectively raised ₹3,051 crore. In July, three equity NFOs raised ₹768 crore.
SIF
A practical breakdown of SEBI's new SIF category minimum investment, strategies, risk, liquidity and taxation and how it compares to…
 Investment Strategies
A data-backed comparison of daily, weekly, and monthly SIP returns across five equity fund categories and five investment horizons. Find…
 Market Analysis
Equity mutual fund inflows rose to ₹29,329 crore in August 2026, up 19% from July, driven by record small-cap inflows…